Playing the rest of the season a million times
with some help from my forecasts
by Clay Davenport
See the original version of this report, based entirely on real data (no projections).
*** Now with ** 3 ** wild cards per league ***
Generated Sun Mar 15 07:01:22 EDT 2026
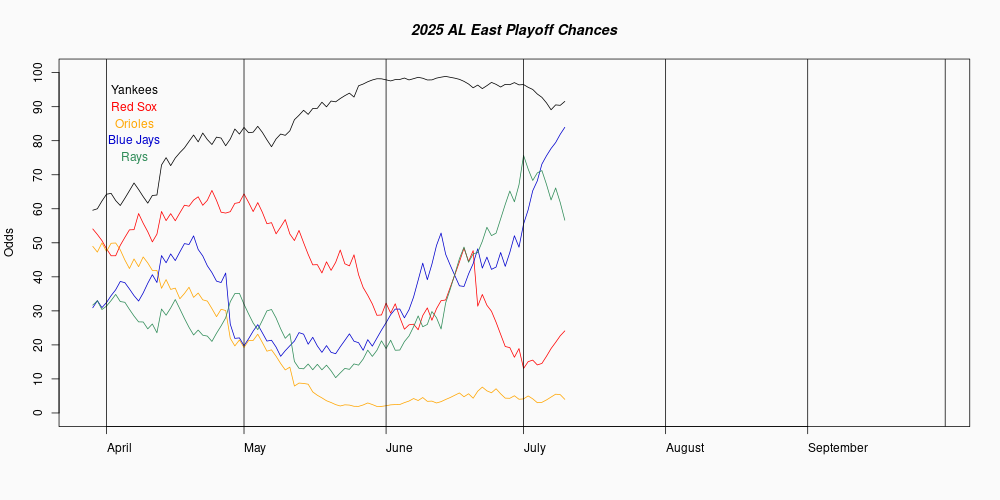
Average wins by position in AL East:  96.1 89.6 84.7 79.8 73.2
AL East           W    L    Pct3  Avg W  Avg L  Champions  Wild Card   Playoffs
Yankees            0    0   .559   88.8   73.2   34.18510   33.07250   67.25760
Red Sox            0    0   .544   86.3   75.7   23.76950   32.58020   56.34970
Orioles            0    0   .535   84.9   77.1   19.11680   30.82340   49.94020
Blue Jays          0    0   .525   83.0   79.0   13.97660   27.40350   41.38010
Rays               0    0   .509   80.4   81.6    8.95200   21.74360   30.69560
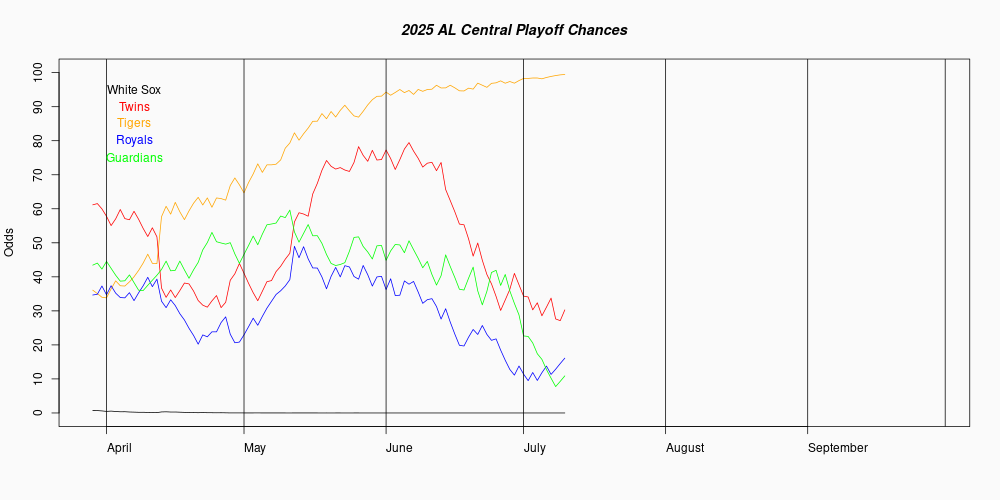
Average wins by position in AL Central:  92.5 84.4 78.0 71.5 62.2
AL Central        W    L    Pct3  Avg W  Avg L  Champions  Wild Card   Playoffs
Tigers             0    0   .543   87.9   74.1   50.94080   16.10450   67.04530
Royals             0    0   .521   84.2   77.8   31.78030   18.47350   50.25380
Twins              0    0   .473   75.9   86.1    8.52220    8.89460   17.41680
Guardians          0    0   .472   75.6   86.4    7.96770    8.57760   16.54530
White Sox          0    0   .410   64.9   97.1     .78900     .97130    1.76030
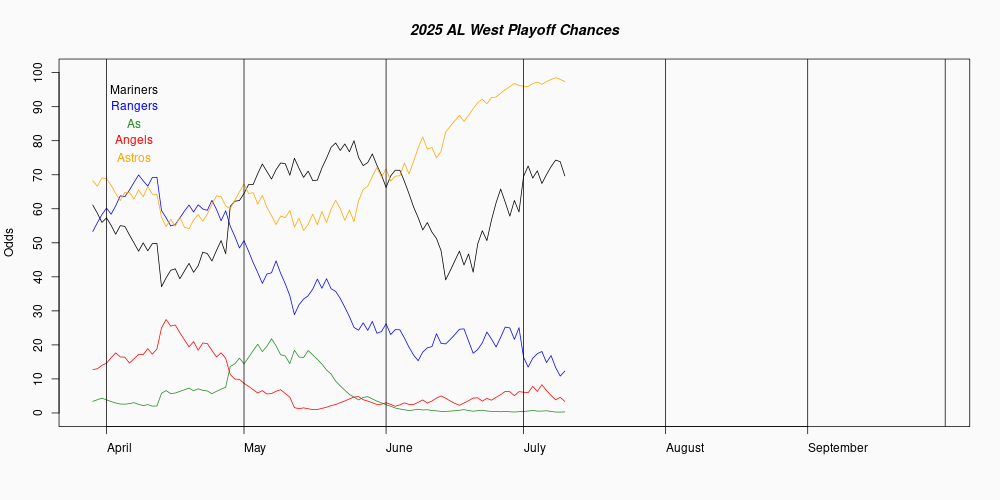
Average wins by position in AL west:  98.8 88.5 81.5 74.4 65.3
AL West           W    L    Pct3  Avg W  Avg L  Champions  Wild Card   Playoffs
Mariners           0    0   .599   96.7   65.3   71.32940   19.35160   90.68100
Astros             0    0   .530   85.0   77.0   14.87410   35.91600   50.79010
Rangers            0    0   .522   83.1   78.9   10.92630   31.28860   42.21490
Athletics          0    0   .476   75.3   86.7    2.42080   11.80300   14.22380
Angels             0    0   .437   68.4   93.6     .44940    2.99610    3.44550

Average wins by AL First Wild Card:  92.5
Average wins by AL Second Wild Card:  88.7
Average wins by AL Third Wild Card:  86.1
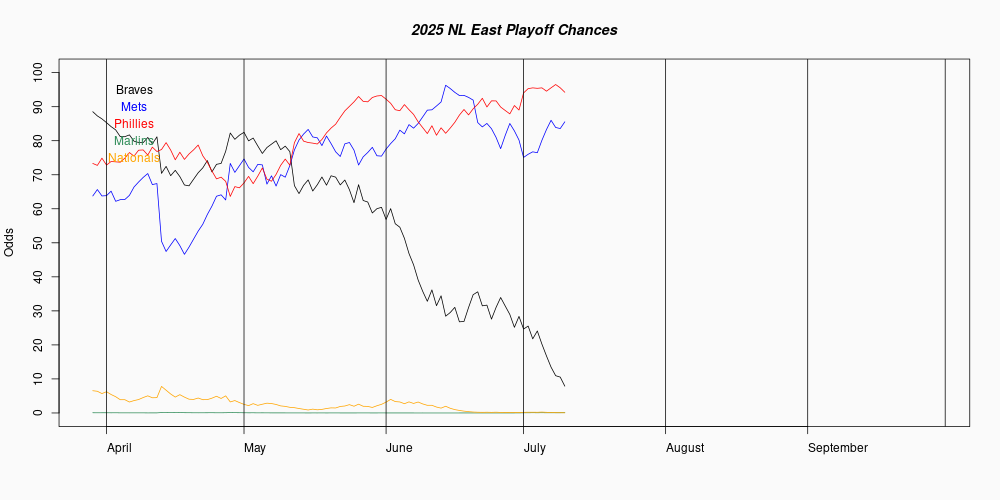
Average wins by position in NL East:  95.5 87.9 81.7 74.8 66.4
NL East           W    L    Pct3  Avg W  Avg L  Champions  Wild Card   Playoffs
Mets               0    0   .559   90.0   72.0   45.05750   31.26980   76.32730
Phillies           0    0   .541   87.0   75.0   30.02320   34.74330   64.76650
Braves             0    0   .526   84.3   77.7   20.27000   32.68700   52.95700
Marlins            0    0   .464   74.0   88.0    3.10880   10.86180   13.97060
Nationals          0    0   .446   70.8   91.2    1.54050    6.19170    7.73220
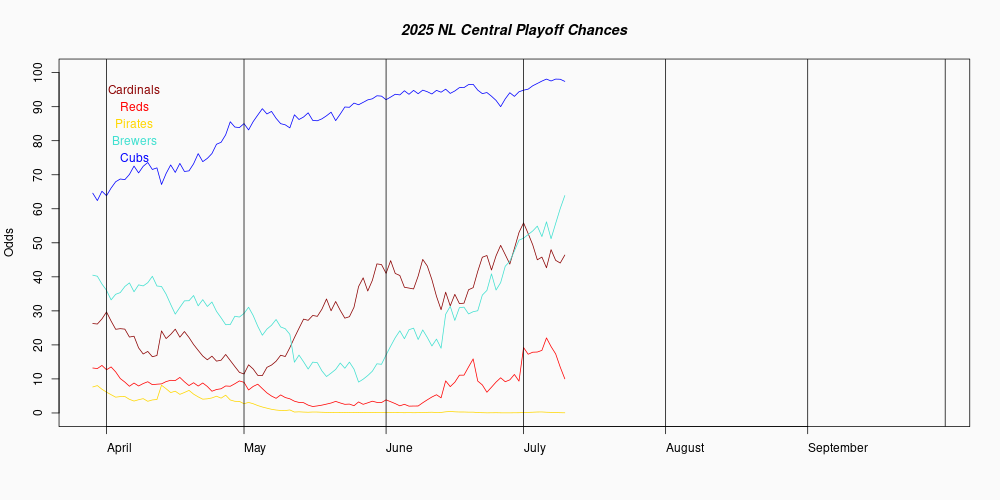
Average wins by position in NL Central:  93.4 85.6 79.9 74.3 66.8
NL Central        W    L    Pct3  Avg W  Avg L  Champions  Wild Card   Playoffs
Cubs               0    0   .550   89.1   72.9   52.62860   21.25690   73.88550
Brewers            0    0   .517   83.2   78.8   23.59500   24.73570   48.33070
Pirates            0    0   .494   79.2   82.8   12.55500   18.50490   31.05990
Reds               0    0   .480   76.9   85.1    8.28390   14.18700   22.47090
Cardinals          0    0   .449   71.6   90.4    2.93750    6.37260    9.31010
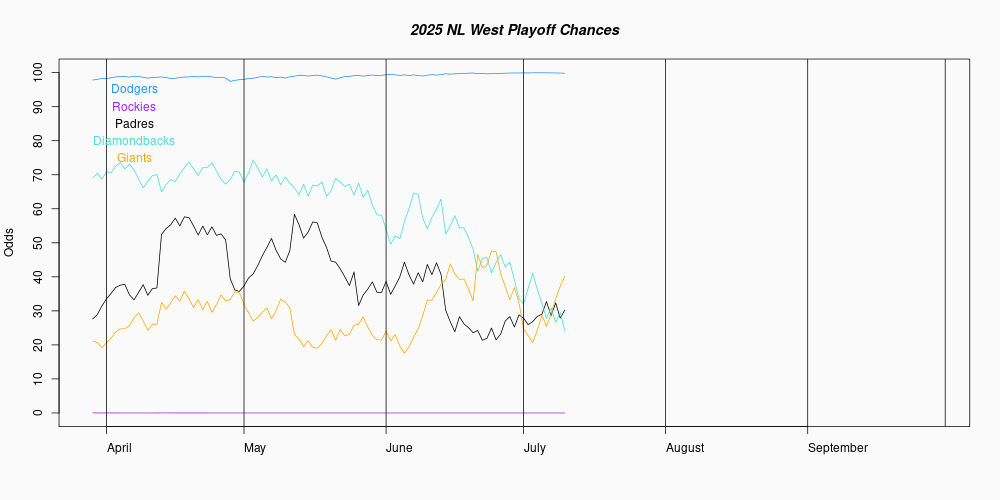
Average wins by position in NL West:  101.4 87.4 80.1 73.1 61.4
NL West           W    L    Pct3  Avg W  Avg L  Champions  Wild Card   Playoffs
Dodgers            0    0   .617  100.5   61.5   86.09940   10.73000   96.82940
Diamondbacks       0    0   .511   82.1   79.9    6.51170   35.84510   42.35680
Giants             0    0   .494   79.2   82.8    3.83410   26.52520   30.35930
Padres             0    0   .493   78.8   83.2    3.49580   25.00630   28.50210
Rockies            0    0   .398   62.7   99.3     .05900    1.08270    1.14170

Average wins by NL First Wild Card:  91.8
Average wins by NL Second Wild Card:  87.7
Average wins by NL Third Wild Card:  85.0
Expected winning percentages (EWP) is being driven entirely by the projections of player performance on our depth charts. The performances of every player on a team are combined to derive total team runs scored and allowed, which are averaged and normalized on a league basis, and used to calculate a won/lost record. The disadvantage of this approach is that the team's rating is entirely based on a projection of player performance. The advantage is that it can immediately respond to changes in the team's lineup, due to injury or trade. However, we still allow for uncertainty in the EWP by sampling a normal distribution centered on the EWP for each "seasonal" run. To simulate the normal 4% home-field advantage, the home team gets a .020 point bonus, while the visitors take a 0.020 penalty. The likelihood of winning each game is determined by the log5 method.
W and L are the team's wins and losses through yesterday's games.
Pct3 is the expected winning percentage, taken from W3 and L3, with the regression-to-mean component.
Avg W and Avg L are the average number of wins and losses each team finishes over the million season iterations.
Champions is how often, in percentage terms, this team won the championship of their division. Ties are not broken, but credited as 0.5 championships apiece (for a two-way tie), .333 apiece for a three-way tie, .25 for four-way, etc. This is why the final decimal place is not an error!
Wild Card is how often, in percentage terms, this team won the wild card. As with championships, ties are not broken, but apportioned among the tied teams.
Playoffs is how often, in percentage terms, the team either wins the division or the wild card.