Playing the rest of the season a million times
using Elo as the determining factor
by Clay Davenport
See the original version of this report, based entirely on real data (no projections). See the Forecast version of this report, based team rosters and projected performance.
Generated Sun Apr 8 08:26:46 EDT 2012
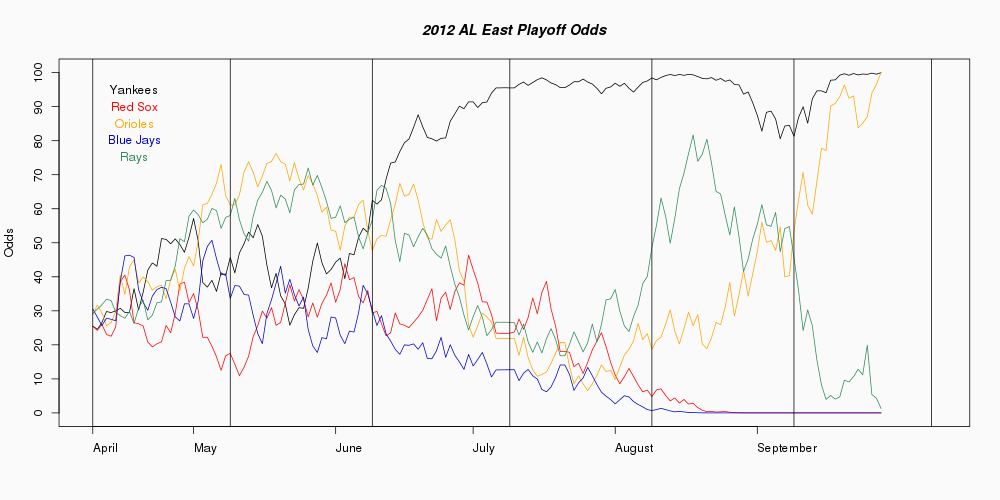
Average wins by position in AL East:  97.0 91.0 90.0 81.0 69.0
AL East           W    L    Pct3  Avg W  Avg L  Champions  Wild Card   Playoffs
Yankees           97   65  1576.   97.0   65.0  100.00000     .00000  100.00000
Rays              91   71  1563.   91.0   71.0     .00000  100.00000  100.00000
Red Sox           90   72  1541.   90.0   72.0     .00000     .00000     .00000
Blue Jays         81   81  1511.   81.0   81.0     .00000     .00000     .00000
Orioles           69   93  1466.   69.0   93.0     .00000     .00000     .00000
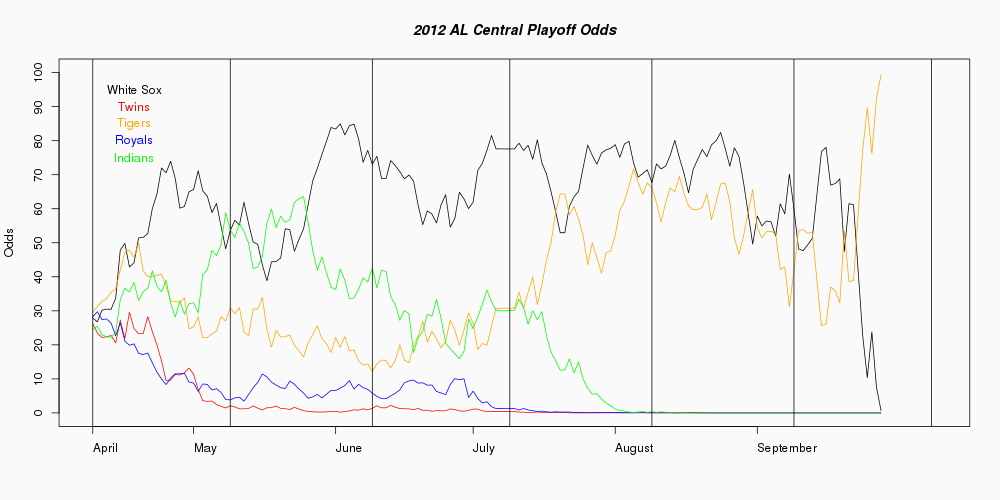
Average wins by position in AL Central:  95.0 80.0 79.0 71.0 63.0
AL Central        W    L    Pct3  Avg W  Avg L  Champions  Wild Card   Playoffs
Tigers            95   67  1550.   95.0   67.0  100.00000     .00000  100.00000
Indians           80   82  1482.   80.0   82.0     .00000     .00000     .00000
White Sox         79   83  1490.   79.0   83.0     .00000     .00000     .00000
Royals            71   91  1482.   71.0   91.0     .00000     .00000     .00000
Twins             63   99  1431.   63.0   99.0     .00000     .00000     .00000
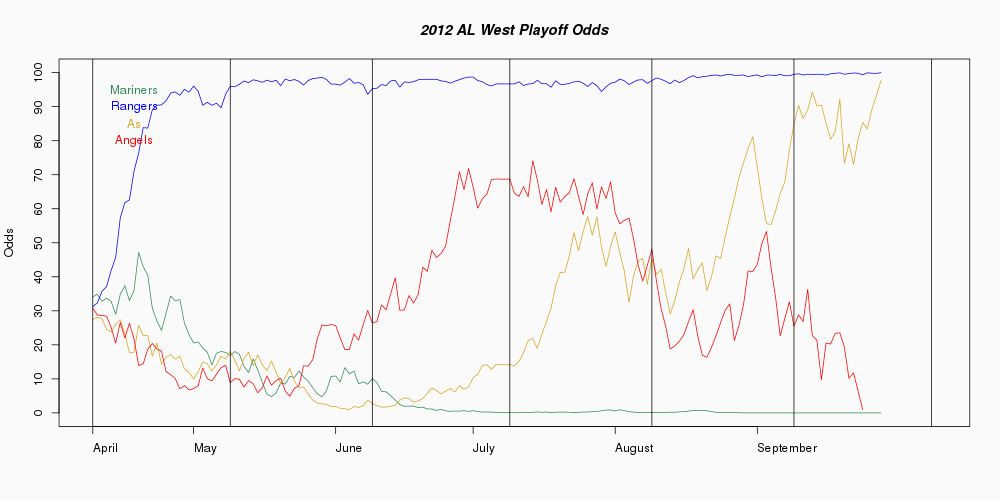
Average wins by position in AL west:  96.0 86.0 74.0 67.0
AL West           W    L    Pct3  Avg W  Avg L  Champions  Wild Card   Playoffs
Rangers           96   66  1576.   96.0   66.0  100.00000     .00000  100.00000
Angels            86   76  1526.   86.0   76.0     .00000     .00000     .00000
Athletics         74   88  1486.   74.0   88.0     .00000     .00000     .00000
Mariners          67   95  1441.   67.0   95.0     .00000     .00000     .00000

Average wins by AL Wild Card:  91.0
Average wins by position in NL East:  102.0 89.0 80.0 77.0 72.0
NL East           W    L    Pct3  Avg W  Avg L  Champions  Wild Card   Playoffs
Phillies         102   60  1572.  102.0   60.0  100.00000     .00000  100.00000
Braves            89   73  1506.   89.0   73.0     .00000     .00000     .00000
Nationals         80   81  1489.   80.0   81.0     .00000     .00000     .00000
Mets              77   85  1488.   77.0   85.0     .00000     .00000     .00000
Marlins           72   90  1464.   72.0   90.0     .00000     .00000     .00000
Average wins by position in NL Central:  96.0 90.0 79.0 72.0 71.0 56.0
NL Central        W    L    Pct3  Avg W  Avg L  Champions  Wild Card   Playoffs
Brewers           96   66  1551.   96.0   66.0  100.00000     .00000  100.00000
Cardinals         90   72  1531.   90.0   72.0     .00000  100.00000  100.00000
Reds              79   83  1481.   79.0   83.0     .00000     .00000     .00000
Pirates           72   90  1437.   72.0   90.0     .00000     .00000     .00000
Cubs              71   91  1475.   71.0   91.0     .00000     .00000     .00000
Astros            56  106  1417.   56.0  106.0     .00000     .00000     .00000
Average wins by position in NL West:  94.0 86.0 82.0 73.0 71.0
NL West           W    L    Pct3  Avg W  Avg L  Champions  Wild Card   Playoffs
Diamondbacks      94   68  1538.   94.0   68.0  100.00000     .00000  100.00000
Giants            86   76  1492.   86.0   76.0     .00000     .00000     .00000
Dodgers           82   79  1520.   82.0   79.0     .00000     .00000     .00000
Rockies           73   89  1454.   73.0   89.0     .00000     .00000     .00000
Padres            71   91  1464.   71.0   91.0     .00000     .00000     .00000

Average wins by NL Wild Card:  90.0
In this version we use the team's Elo scores as their expected winning percentage. Within the simulation, each team's Elo is tracked and updated through all simulated games, which is used to predict the next game, and so on. W and L are the team's wins and losses through yesterday's games.
Pct3 is the Elo score calculated through the latest games played. Avg W and Avg L are the average number of wins and losses each team finishes over the million season iterations.
Champions is how often, in percentage terms, this team won the championship of their division. Ties are not broken, but credited as 0.5 championships apiece (for a two-way tie), .333 apiece for a three-way tie, .25 for four-way, etc. This is why the final decimal place is not an error!
Wild Card is how often, in percentage terms, this team won the wild card. As with championships, ties are not broken, but apportioned among the tied teams.
Playoffs is how often, in percentage terms, the team either wins the division or the wild card.