Playing the rest of the season a million times
by Clay Davenport
See the Forecast-adjusted version of this report.
Generated Thu Jul 9 07:52:15 AM EDT 2026
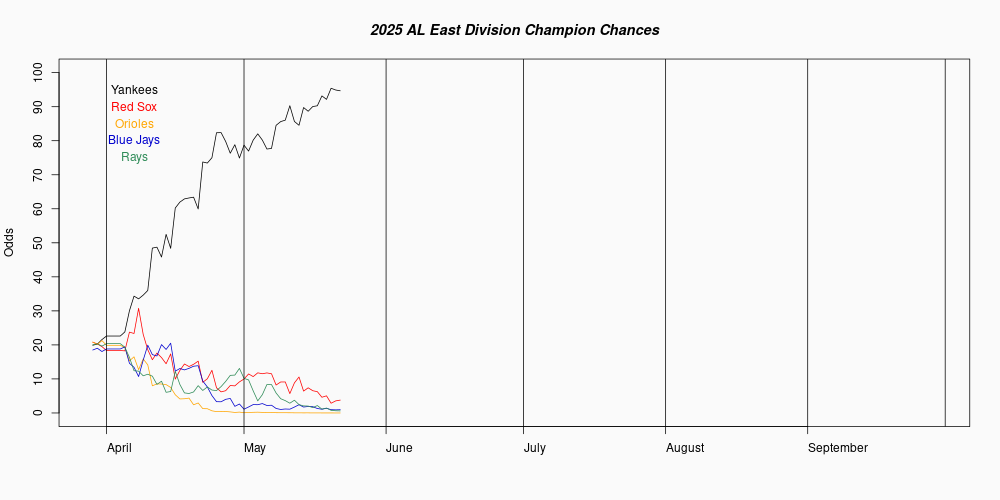
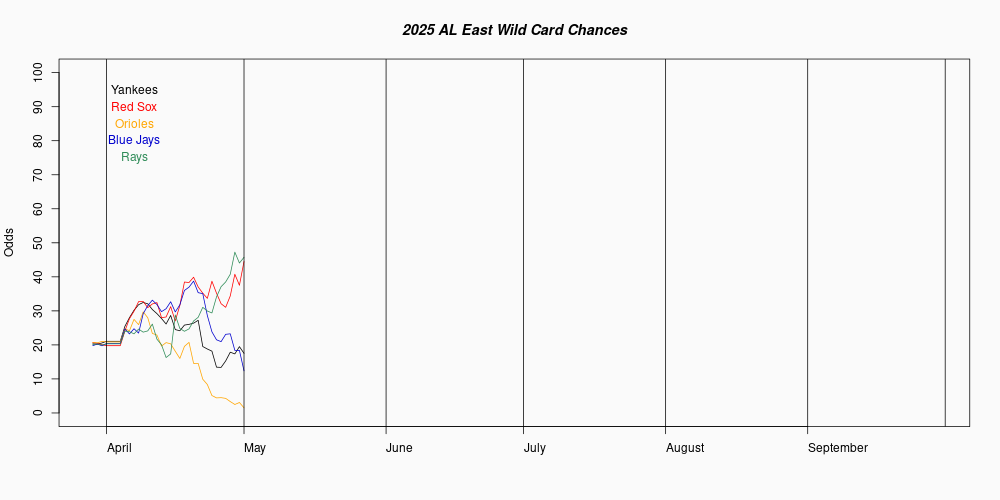
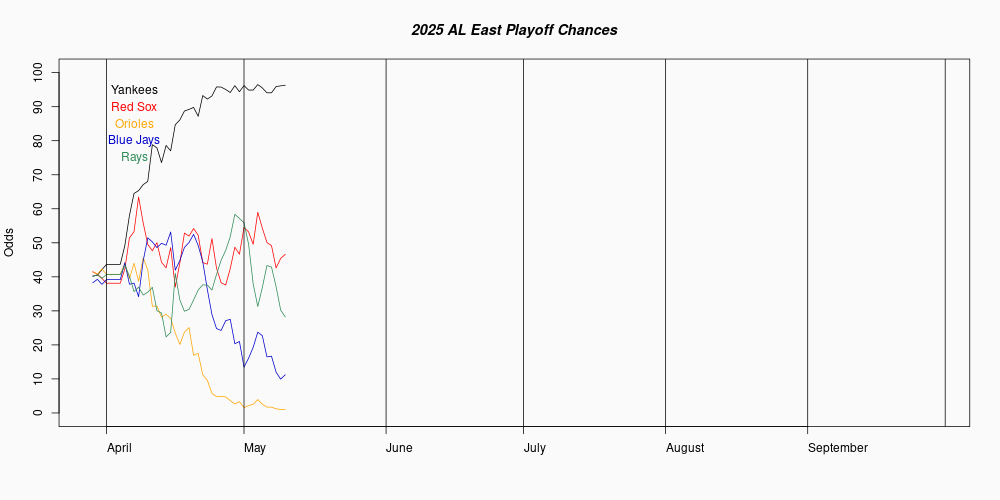
Average wins by position in AL East:  95.8 89.2 81.7 77.2 72.5
AL East           W    L    Pct3  Avg W  Avg L  Champions  Wild Card   Playoffs      1D Change 7D Change
Rays              54   36   .557   94.6   67.4   73.61460   25.82890   99.44350         .39750    .48029
Yankees           50   42   .568   89.9   72.1   25.17760   70.45830   95.63590       -0.85960  -2.43250
Blue Jays         44   49   .488   77.7   84.3     .35490   23.48120   23.83610        6.25910  -3.98750
Red Sox           42   48   .520   79.3   82.7     .77460   34.04550   34.82010        7.19190  23.76450
Orioles           42   51   .481   74.8   87.2     .07830    9.36060    9.43890       -1.06820  -4.10450
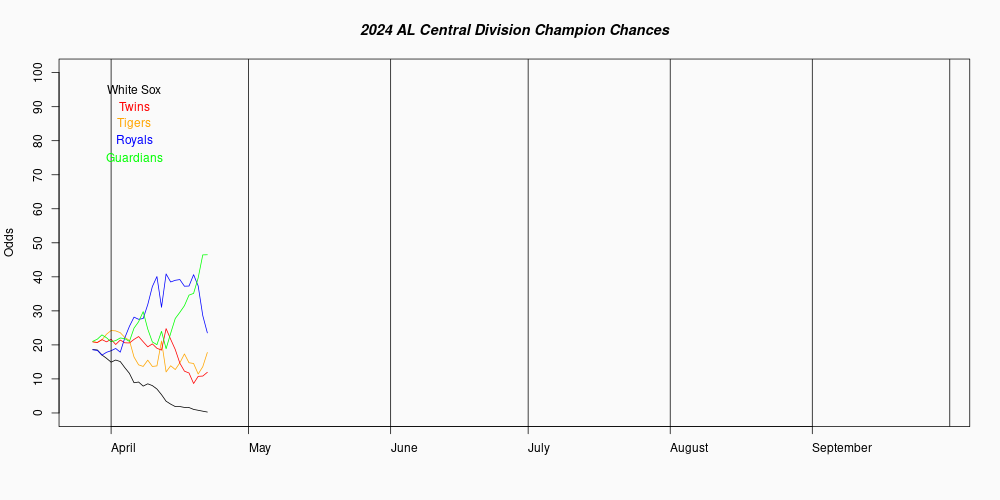
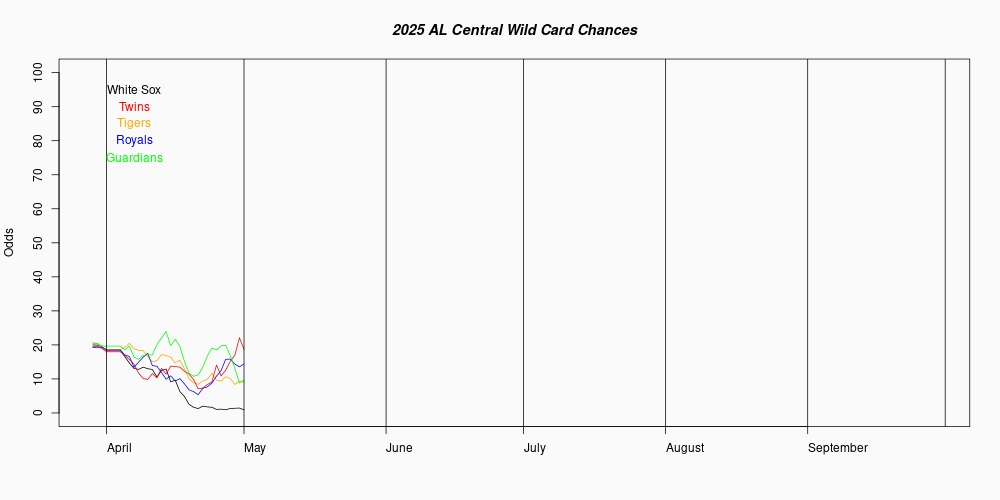
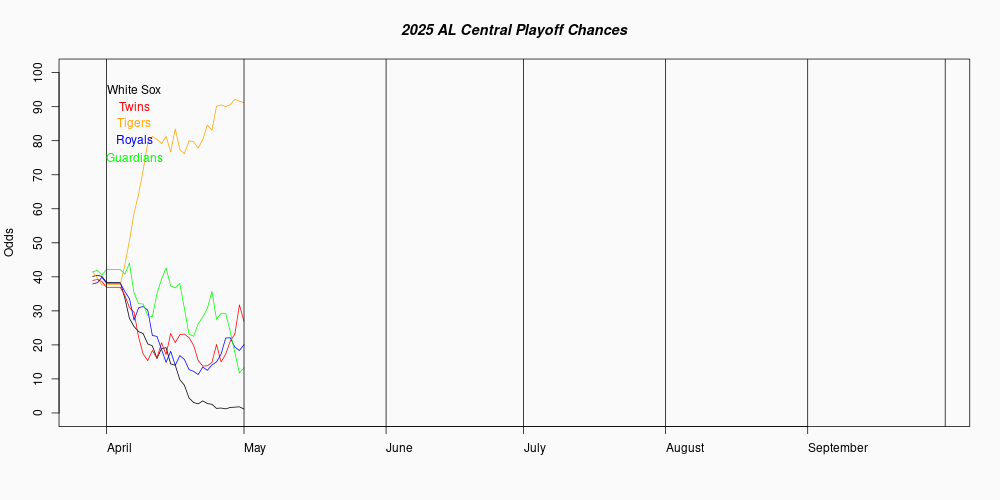
Average wins by position in AL Central:  86.3 82.4 79.2 75.6 68.6
AL Central        W    L    Pct3  Avg W  Avg L  Champions  Wild Card   Playoffs      1D Change 7D Change
White Sox         47   44   .493   82.7   79.3   38.90450   23.36650   62.27100       -5.06710 -15.80370
Guardians         47   46   .481   81.3   80.7   27.97280   23.35770   51.33050       -4.25290 -13.66110
Twins             46   47   .485   80.1   81.9   19.63630   21.40040   41.03670        5.66800  22.13090
Tigers            42   50   .520   78.8   83.2   13.25320   17.77370   31.02690        4.31630   9.14880
Royals            38   55   .446   69.2   92.8     .23320     .68870     .92190       -0.31030  -0.07870
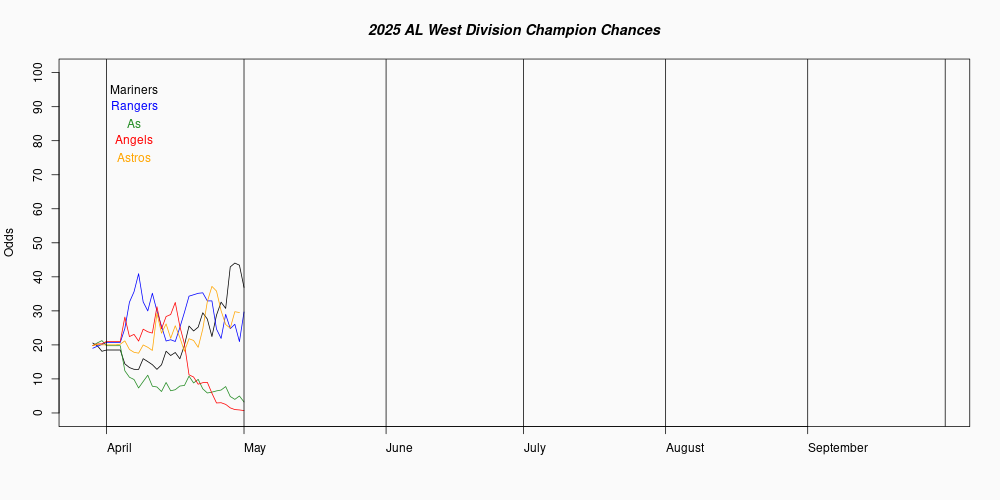
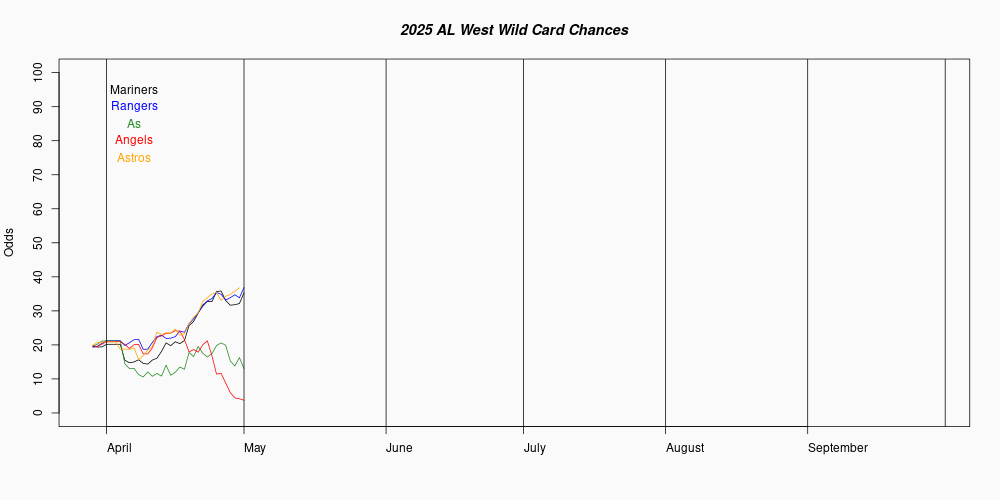
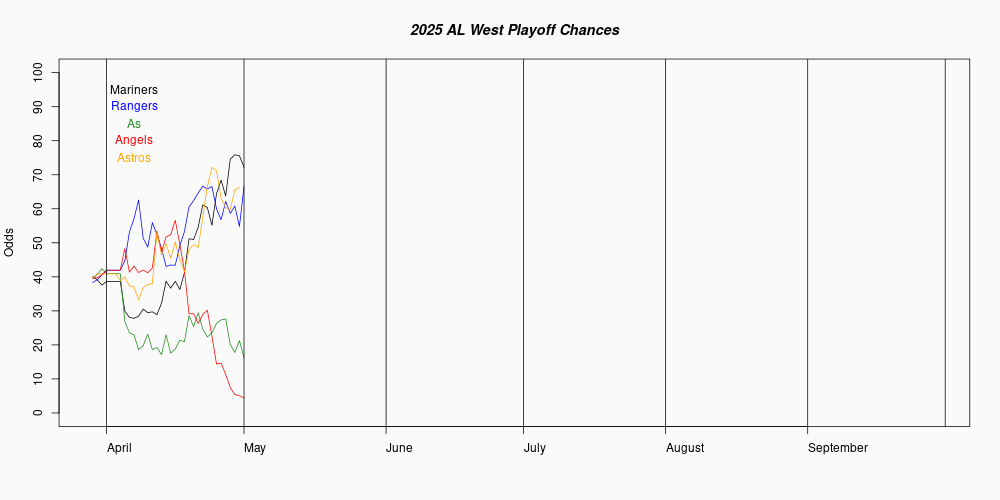
Average wins by position in AL west:  85.6 80.9 76.8 71.9 67.0
AL West           W    L    Pct3  Avg W  Avg L  Champions  Wild Card   Playoffs      1D Change 7D Change
Mariners          47   46   .517   82.7   79.3   49.00450   17.81740   66.82190       -1.82430   5.23320
Rangers           46   46   .500   81.8   80.2   38.97620   18.96460   57.94080       -7.44140  -7.14710
Astros            46   49   .456   77.4   84.6   10.30190   11.16320   21.46510       -2.79820   1.79140
Athletics         41   51   .425   71.2   90.8    1.26550    1.74590    3.01140       -0.69790 -11.57730
Angels            37   56   .465   69.0   93.0     .45190     .54740     .99930         .48710  -3.75670

Average wins by AL Wild Card:  89.4 84.2 84.0
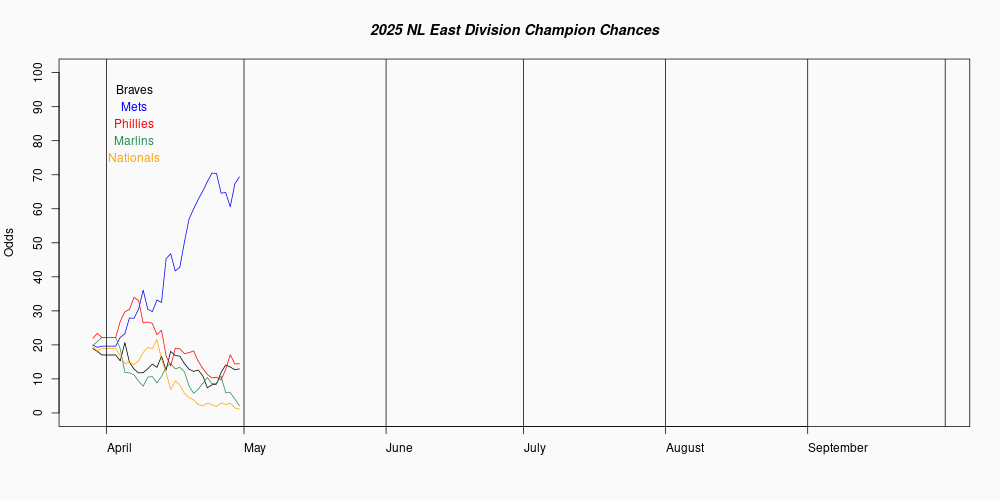
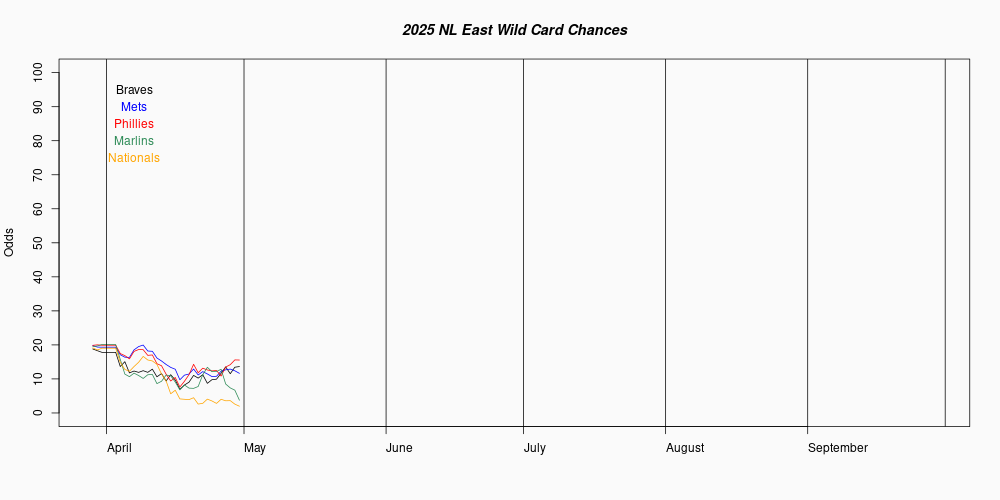
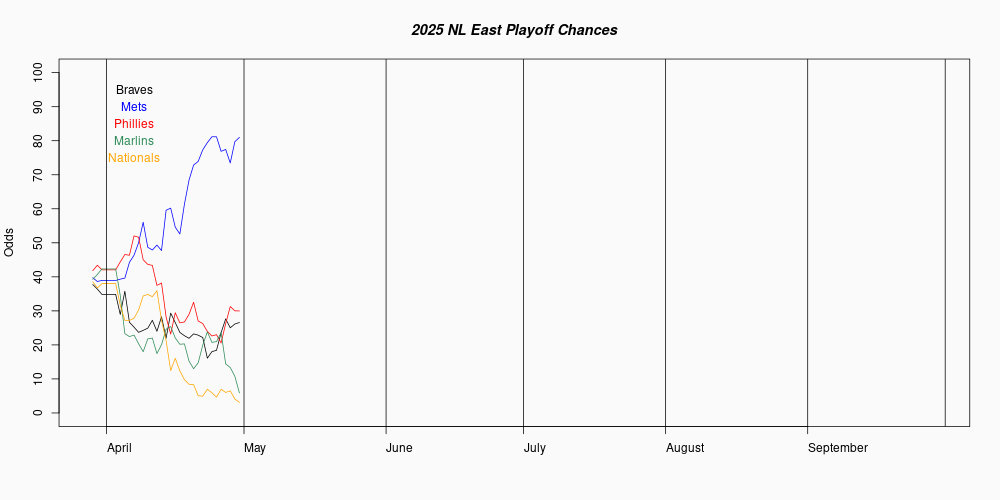
Average wins by position in NL East:  93.5 88.8 84.2 79.6 68.8
NL East           W    L    Pct3  Avg W  Avg L  Champions  Wild Card   Playoffs      1D Change 7D Change
Braves            53   38   .536   90.9   71.1   50.46230   37.75140   88.21370        2.58530  -3.63360
Marlins           51   42   .563   89.9   72.1   40.09800   44.07340   84.17140        2.59330  15.39780
Phillies          51   42   .472   82.7   79.3    4.86730   26.17680   31.04410       -8.03900 -21.01490
Nationals         48   46   .504   82.6   79.4    4.56860   25.79740   30.36600        3.79350    .42550
Mets              39   54   .454   69.0   93.0     .00380     .08290     .08670         .02390  -0.10040
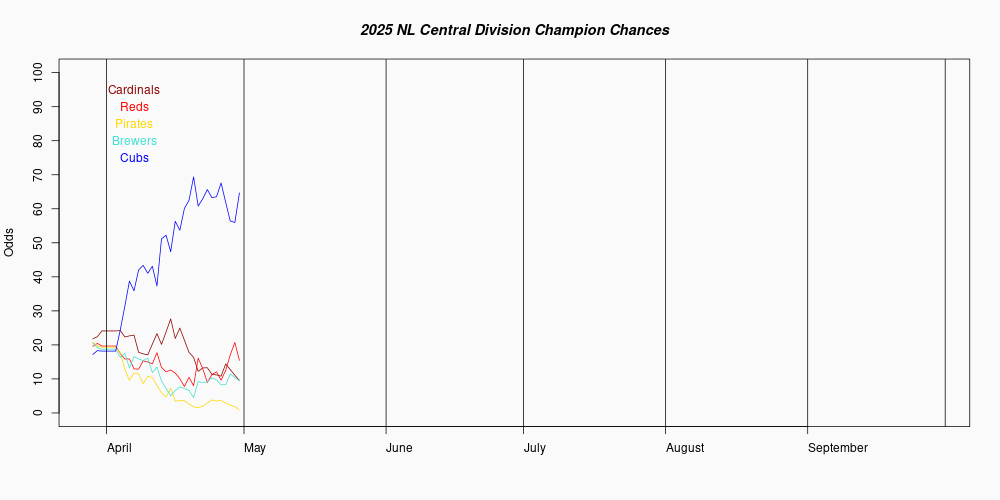
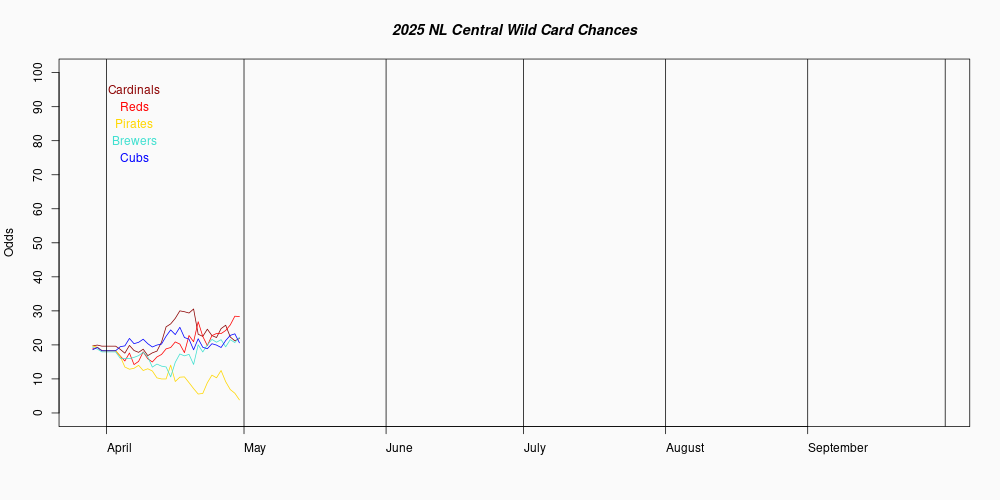
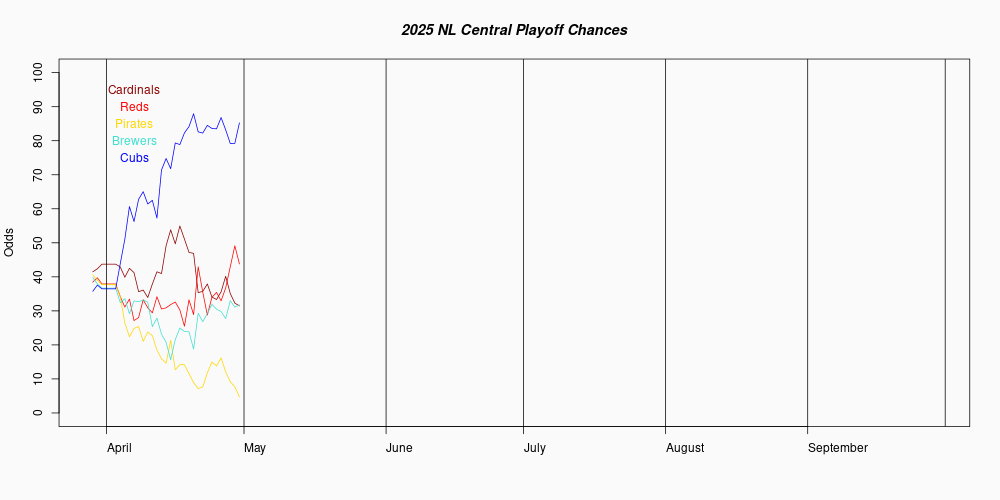
Average wins by position in NL Central:  99.9 89.7 85.0 80.5 70.8
NL Central        W    L    Pct3  Avg W  Avg L  Champions  Wild Card   Playoffs      1D Change 7D Change
Brewers           58   34   .602   99.7   62.3   93.35320    6.41900   99.77220       -0.05860    .24250
Cubs              52   40   .529   87.7   74.3    4.61240   66.96390   71.57630        1.23590  -7.59810
Cardinals         48   43   .502   83.5   78.5     .79640   36.97280   37.76920        5.09100  12.29750
Pirates           47   46   .554   84.0   78.0    1.23660   40.12870   41.36530       -5.93260  10.61450
Reds              42   49   .428   71.0   91.0     .00140     .40950     .41090         .11840    .02490
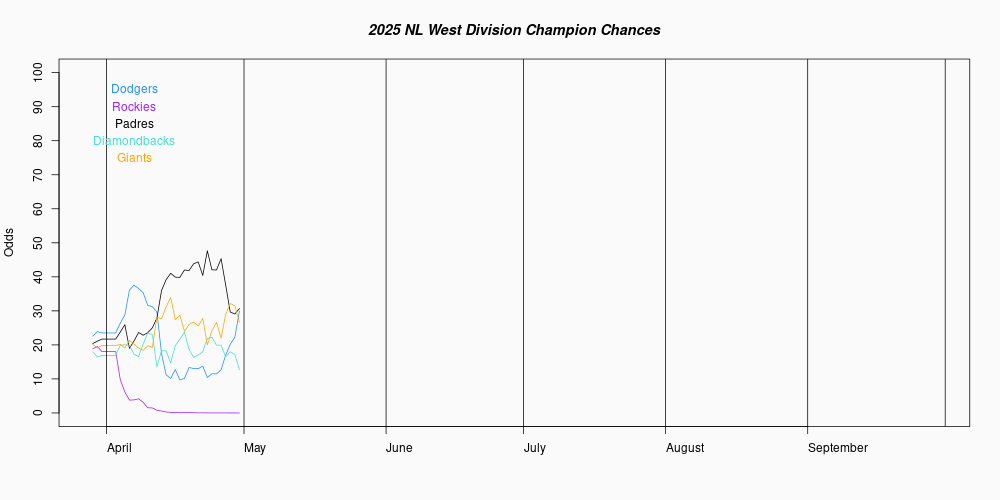
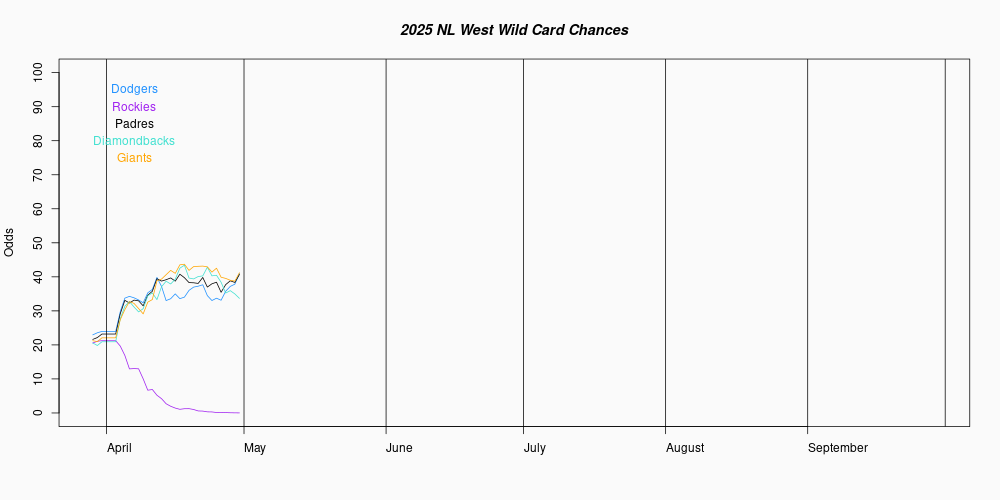
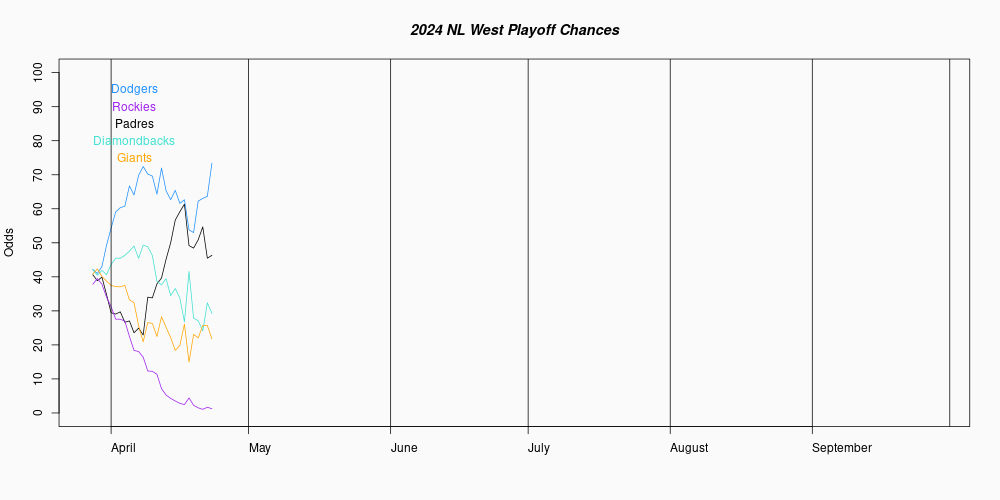
Average wins by position in NL West:  103.8 81.1 76.3 71.6 65.6
NL West           W    L    Pct3  Avg W  Avg L  Champions  Wild Card   Playoffs      1D Change 7D Change
Dodgers           61   33   .629  103.8   58.2   99.98120     .01590   99.99710         .00170    .00240
Padres            46   46   .461   78.2   83.8     .00830    8.00920    8.01750        1.27400  -0.29840
Diamondbacks      45   47   .464   77.6   84.4     .01050    6.70720    6.71770       -2.22570  -4.39930
Giants            38   54   .479   72.1   89.9     .00000     .47590     .47590       -0.45960  -1.96980
Rockies           38   56   .423   66.6   95.4     .00000     .01600     .01600       -0.00150    .00940

Average wins by NL Wild Card:  91.2 88.1 85.6
Expected winning percentages (EWP) for each team starts with their W3 and L3 from the Adjusted Standings. A regression is applied to derive the EWP for the rest of the season, which is going to be between the current winning percentage and .500. To allow for uncertainty in the EWP, a normal distribution centered on the EWP is randomly sampled, and that value is used for the remainder of the season in that iteration. To simulate the normal 4% home-field advantage, the home team gets a .020 point bonus, while the visitors take a 0.020 penalty. The likelihood of winning each game is determined by the log5 method. W and L are the team's wins and losses through yesterday's games.
Pct3 is the expected winning percentage, taken from W3 and L3, with the regression-to-mean component.
Avg W and Avg L are the average number of wins and losses each team finishes over the million season iterations.
Champions is how often, in percentage terms, this team won the championship of their division. Ties are not broken, but credited as 0.5 championships apiece (for a two-way tie), .333 apiece for a three-way tie, .25 for four-way, etc. This is why the final decimal place is not an error!
Wild Card is how often, in percentage terms, this team won the wild card. As with championships, ties are not broken, but apportioned among the tied teams.
Playoffs is how often, in percentage terms, the team either wins the division or the wild card.